Suspension Kinematics and Compliance Test – MTS: A Parts Buyer's Guide to Reading K&C Data
Kinematics and Compliance (K&C) testing measures how a vehicle's wheels move and deflect under realistic loads — and the resulting curves tell you whether a handling problem lives in your bushings, your arm geometry, or your compliance rates. That distinction determines which suspension part actually needs changing. For parts buyers, workshop mechanics, and importers, K&C data is not an OEM-only engineering artifact. It is a component-level diagnostic that separates a marketing claim from a measurable improvement.
What K&C Testing Actually Measures
K&C testing is quasi-static suspension testing. The rig applies realistic loads and displacements, then measures how the wheels move and deflect in response.
- Kinematics covers geometry-driven motion — how camber, toe, and caster change as the wheel travels.
- Compliance covers deflection-driven motion — how bushings, links, and joints flex under lateral, longitudinal, and vertical loads.
A K&C rig separates these two behaviors. That separation is the diagnostic value. When a customer complains of rear instability under braking, the question is not "is the damper worn?" It is "is the rear toe changing under longitudinal load, and if so, is that change coming from bushing deflection or from arm pivot geometry?" K&C data answers with curves, not opinions.
The output is a set of plots: camber versus wheel travel, toe versus lateral force, toe versus longitudinal force, caster and KPI versus steer angle. Each curve isolates a specific behavior. A toe change under braking that exceeds the vehicle's design target points to a bushing or arm geometry issue — not a damper issue. A camber curve that goes positive in compression points to arm length or pivot location, not spring rate.
For aftermarket parts development, this matters because it lets you evaluate whether a replacement control arm or bushing actually corrects a known handling complaint. If the original equipment rear trailing arm bushing allows 0.8 degrees of toe change under 3 kN of lateral force, and your replacement bushing reduces that to 0.3 degrees, you have a quantifiable improvement — not a marketing claim. That is the difference between selling a part and selling a solution.
How an MTS K&C Rig Works and What Capabilities Matter for Parts Testing
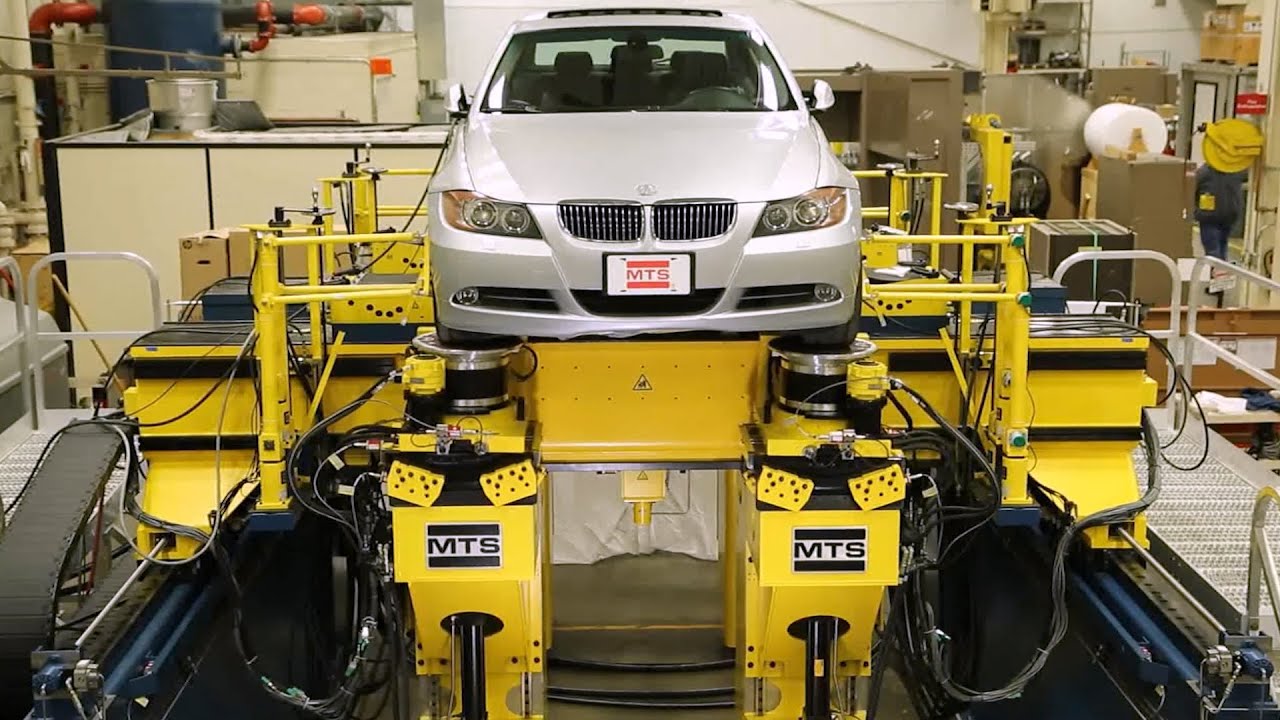
An MTS K&C rig applies precise motion or force inputs at the tire contact patches or spindle, then measures resulting wheel position changes with high-resolution sensors. The system architecture typically includes four wheel pads (one per tire), hydraulic or electric actuators, a vehicle restraint system, and a data acquisition system that records wheel position, force, and moment at each corner.
The rig operates in two primary modes:
- Kinematic mode: the suspension is moved through its travel range while compliance effects are minimized or fixed — this isolates geometry.
- Compliance mode: forces are applied at the contact patch while the suspension is held at a fixed ride height — this isolates deflection.
Some systems run both simultaneously to capture coupled behavior.
System Capabilities That Determine Whether the Data Is Useful
Key capabilities to evaluate include maximum vehicle weight, force capacity, stroke, and the ability to run both kinematic and compliance test modes. MTS systems are known for high-force, high-precision hydraulic actuation. The spec sheet matters because a rig that cannot reach your target lateral force will not reveal bushing compliance at the limit. If your target vehicle weighs 2,200 kg and you need to apply 8 kN of lateral force per wheel to simulate a 1.0 g corner, the rig must be rated for that force at that stroke.
For aftermarket parts, the relevant question is whether the rig can isolate a single component's contribution. Testing a control arm with different bushing durometers requires the ability to swap components without altering the rest of the suspension. A rigid fixture that replaces the spring and damper, or a setup that locks out other compliance sources, lets you attribute the measured curve change directly to the part you are developing.
Reading K&C Curves: What Each Plot Tells You About Bushings, Geometry, and Compliance
Camber vs. Wheel Travel
This curve reveals kinematic geometry — arm lengths, pivot locations — and compliance effects from bushing deflection under lateral load. A camber curve that gains negative camber in compression is typical for a double-wishbone or multi-link suspension. If the curve flattens or reverses at the travel extremes, the arm geometry is running out of its designed range, or a bushing is deflecting enough to cancel the geometric gain.
Toe vs. Lateral Force
This is the primary compliance curve for rear suspension. A steep slope indicates soft bushings or compliant links — the rear wheels are steering under cornering load. A flat slope indicates stiff bushings or rigid geometry. For a rear trailing arm bushing, this curve is the single most important output. If the slope is steep, the bushing is allowing the arm to deflect laterally, which changes toe and promotes oversteer.
Toe vs. Longitudinal Force (Braking and Traction)
This curve shows whether bushings are allowing excessive toe change under load — a common source of instability. A rear suspension that toes out under braking will feel unstable because the rear axle steers the car. The curve shape tells you whether the deflection is linear (consistent compliance) or nonlinear (bushing reaching a travel limit or binding).
Understeer and Oversteer Balance
Understeer and oversteer tendencies can be inferred from the balance of front and rear compliance curves. More rear toe compliance generally promotes oversteer because the rear axle steers in response to lateral force. More front toe compliance generally promotes understeer. K&C data lets you quantify that balance rather than guessing from seat-of-the-pants impressions.
Caster and KPI vs. Steer Angle
Caster and KPI changes versus steer angle indicate steering-axis geometry and can reveal bump-steer issues. If caster changes significantly as the wheel steers, the steering axis is not where it should be — or a bushing is deflecting under steering load. This curve is often overlooked but is critical for steering feel and straight-line stability.
Static vs. Dynamic K&C Testing: When Each Method Answers Your Question
Static K&C testing applies slow, quasi-static loads to isolate steady-state compliance and kinematic properties without inertial effects. The inputs are ramps or holds — move the wheel slowly through travel, apply a steady lateral force, measure the resulting position change. This is the standard method for characterizing bushing rates and arm geometry.
Dynamic K&C testing introduces higher-frequency inputs to capture transient behavior, such as the effect of damper tuning or bushing rate under rapid load changes. Instead of a slow ramp, the rig applies oscillatory inputs at frequencies that simulate real road inputs or handling maneuvers. The output includes frequency-dependent compliance — how the suspension responds at 1 Hz versus 10 Hz.
For aftermarket parts design, static testing is sufficient to characterize bushing rates and arm geometry. If you are developing a replacement control arm or bushing, static K&C tells you whether the part changes the compliance curve in the intended direction. Dynamic testing matters when validating NVH or transient handling performance — for example, if a stiffer bushing introduces a high-frequency harshness that static testing would not reveal.
Modern vehicles with active suspension or frequency-dependent dampers require dynamic K&C to fully understand compliance behavior. A damper that changes its rate based on input frequency will not show its true behavior under static testing. If you are developing parts for these vehicles, dynamic K&C data is the only way to see how your component interacts with the active system.
From Curve to Component: How K&C Data Drives Bushing, Arm, and Compliance Design Decisions
A steep toe versus lateral force slope indicates excessive compliance. Increasing bushing durometer or switching to a spherical bearing reduces that slope. The K&C curve quantifies the change — you can measure the slope before and after the bushing change and see exactly how much toe steer you eliminated. This is how you specify a bushing: not by durometer alone, but by the compliance curve it produces.
Camber change under lateral load can be reduced by stiffening bushings or revising arm pivot locations to improve the camber curve. If the camber curve shows excessive negative camber gain under cornering load, the bushing is deflecting. A stiffer bushing reduces that deflection, but it also reduces ride compliance. K&C data lets you find the balance — enough stiffness to control camber, not so much that the ride becomes harsh.
Compliance effects in the rear suspension often dominate oversteer tendencies. K&C data can quantify how much a stiffer rear bushing will reduce rear toe steer. For a Large suspension bushing — 54584-2D000 or similar rear suspension component, the design goal is to reduce toe change under lateral force without introducing binding or excessive NVH. The K&C curve is the validation tool.
For aftermarket arms, K&C testing validates whether revised geometry actually delivers the intended camber or toe curve without introducing bump-steer. A control arm with revised pivot locations might look correct on a drawing, but the K&C rig shows whether the camber curve matches the target and whether caster or KPI changes introduce steering issues. This is especially important for Control Arm — 54500-S1AA0 and similar arms where small geometry changes have large effects.
Practical K&C Test Setup for Component Evaluation
Ballast and Tire Pressure
Ensure the vehicle is ballasted to realistic corner weights and tire pressures are set to spec before testing. K&C results are sensitive to ride height and tire pressure. A vehicle tested at the wrong ride height will show different camber and toe curves than one tested at the correct setting. Ballast the vehicle to the weight it will see in service — including driver, passenger, and cargo if those are typical.
Isolate the Component
For component-level testing, isolate the component by locking out other compliance sources or using a rigid fixture that replaces the rest of the suspension. If you are testing a rear trailing arm bushing, you want the measured compliance to come from that bushing, not from the subframe bushings or the damper top mount. A rigid fixture or a locked-out suspension lets you attribute the curve to the part you are developing.
Define a Test Matrix
Define a test matrix that sweeps the relevant inputs: wheel travel, lateral force, longitudinal force, and steer angle. A typical matrix might include ±50 mm of wheel travel, ±5 kN of lateral force, ±3 kN of longitudinal force, and ±20 degrees of steer angle. The matrix should cover the range the suspension sees in service — not just the linear region.
Baseline Before You Change Anything
Baseline the vehicle or component before making changes so you can quantify the delta from a new bushing or arm. Run the full test matrix on the original equipment part, then repeat with the new part. The difference between the two curves is your performance claim. Without a baseline, you have data but no context.
Applications of K&C Testing: Benchmarking, Target Setting, and Problem Diagnosis
- Benchmarking competitor vehicles or components establishes performance targets for aftermarket parts. If you are developing a replacement control arm for a popular platform, testing the original equipment part and a competitor's part gives you a target curve. Your part should meet or exceed that curve in the areas that matter — camber control, toe compliance, bump-steer.
- Target setting for new suspension designs means defining desired compliance and kinematic curves before prototyping. Instead of building a part and hoping it works, you define the target curve and design the part to meet it. K&C testing validates whether the prototype hits the target.
- Model verification validates multibody simulation models against measured K&C data. If your simulation predicts a certain camber curve and the K&C rig measures a different one, the model needs adjustment. This is how you build confidence in simulation as a design tool.
- Design change evaluation quantifies the effect of a new bushing or arm on the overall suspension behavior. A Large suspension bushing — 54584-3S100 with a different durometer will change the compliance curve. K&C testing measures that change and tells you whether it is in the intended direction.
- Problem diagnosis traces a handling complaint — such as rear instability — to a specific compliance or kinematic issue. If the rear toe versus lateral force curve shows excessive compliance, the problem is a bushing or link. If the camber curve shows a geometry issue, the problem is the arm. K&C data turns a vague complaint into a specific part specification.
Turning K&C Data into a Parts Decision: A Step-by-Step Framework
- Identify the handling symptom and map it to the relevant K&C curve. Understeer maps to front compliance curves. Oversteer maps to rear toe compliance. Instability under braking maps to toe versus longitudinal force. Write down the symptom and the curve before you look at data.
- Compare the measured curve to a target or baseline to quantify the deviation. If the target is 0.2 degrees of toe change per kN of lateral force and the measured value is 0.6 degrees, the deviation is 0.4 degrees. That number is your design target.
- Determine whether the deviation is kinematic (geometry) or compliance (bushing) in origin. If the curve shape is linear and the slope is steep, it is compliance — a bushing or link is deflecting. If the curve shape is nonlinear or the deviation appears at specific travel points, it is kinematic — the arm geometry is wrong.
- Select the component change that addresses the root cause. For compliance, specify a stiffer bushing or a spherical bearing. For kinematics, specify a revised arm with different pivot locations. Do not change both at once unless you can test them separately.
- Re-test to verify the change achieved the desired curve shift. If the new curve matches the target, the part is validated. If not, iterate. K&C testing is a loop — measure, change, measure again.
This framework works for any suspension component, from a Large suspension bushing — 54584-BU000 to a complete control arm. The data tells you what to change and whether the change worked.
FAQ
What is the difference between kinematics and compliance in K&C testing?
Kinematics is geometry-driven motion — how camber, toe, and caster change as the wheel travels. Compliance is deflection-driven motion — how bushings, links, and joints flex under load. A K&C rig separates the two so you can see which one is causing a handling problem.
Can K&C testing tell me whether to replace a bushing or a control arm?
Yes. If the toe versus lateral force curve has a steep, linear slope, the problem is compliance — a bushing or link is deflecting. If the curve is nonlinear or the deviation appears at specific travel points, the problem is kinematic — the arm geometry is wrong.
Do I need dynamic K&C testing for aftermarket parts development?
Static K&C is sufficient to characterize bushing rates and arm geometry for most aftermarket parts. Dynamic K&C matters when validating NVH or transient handling performance, or when developing parts for vehicles with active suspension or frequency-dependent dampers.
What should I baseline before testing a new suspension component?
Run the full test matrix on the original equipment part first, then repeat with the new part. The difference between the two curves is your performance claim. Without a baseline, you have data but no context.
How do I know if a K&C rig can test my target vehicle?
Check the rig's maximum vehicle weight, force capacity, and stroke. If your target vehicle weighs 2,200 kg and you need 8 kN of lateral force per wheel to simulate a 1.0 g corner, the rig must be rated for that force at that stroke.