Suspension Damper Dyno Testing: When It Changes a Decision (and When It Doesn't)
Dyno a damper only when the result will change what you buy, how you set it up, or whether you accept a production batch. A force-velocity curve that sits in a folder and never influences a purchase order, a shim stack change, or a supplier conversation is entertainment, not engineering [MODEL_ANALYSIS].
Three decision types justify the cost. Selection — comparing two or three candidate dampers for the same corner weight and spring rate before committing to a container order. Setup — adjusting an existing adjustable damper and verifying the adjustment actually does what the knob claims. Consistency — verifying that batch 2 matches batch 1, or that a returned unit is genuinely worn rather than merely old [MODEL_ANALYSIS].
If none of those three decisions is on the table, spend the money on tires instead. The dyno is a measurement tool, not a performance upgrade. Its output is a number that either settles an argument or it does not.
What Force-Velocity and Hysteresis Curves Actually Tell You About a Damper
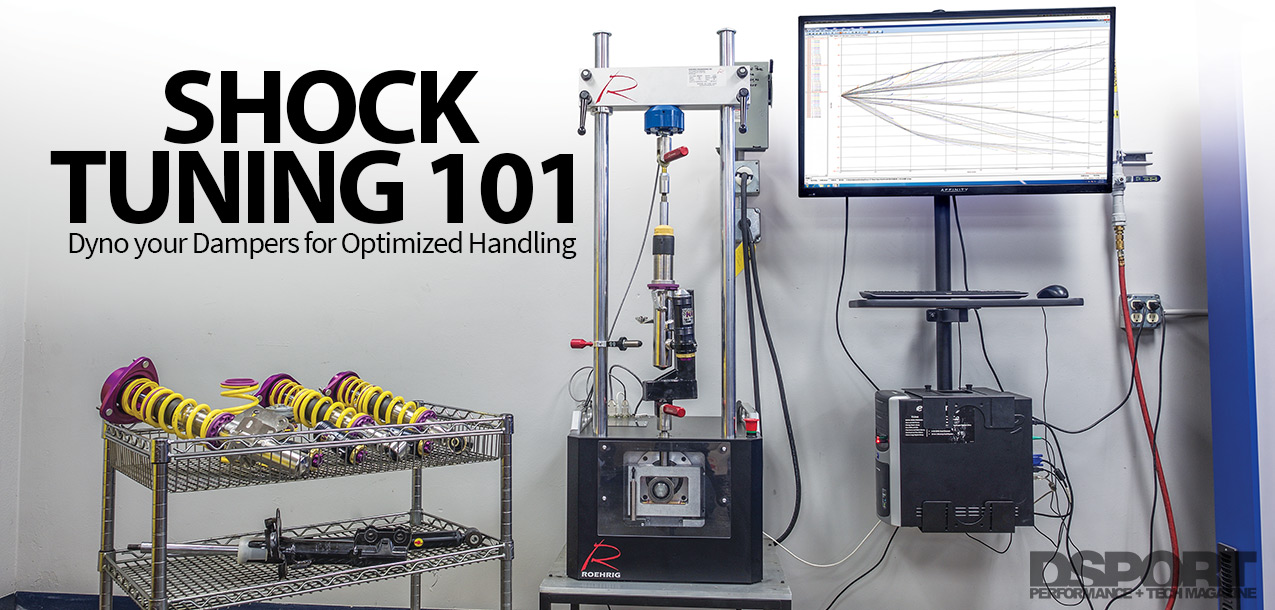
A force-velocity curve plots damping force against shaft speed. That single sentence contains the entire buying decision: the shape of the curve — linear, digressive, or progressive — determines how the car behaves in low-speed events (body roll, weight transfer, turn-in) versus high-speed events (curbs, potholes, sharp impacts) [SEARCH_EVIDENCE].
A digressive curve produces high force at low shaft speeds and flattens at high speeds. That is the classic performance-car shape: it controls body motion without making the car harsh over sharp bumps. A linear curve is predictable but often too stiff at high speed for street use. A progressive curve ramps up force with speed and is common in heavy vehicles and some off-road applications.
Hysteresis is the gap between compression and rebound force at the same velocity. Excessive hysteresis means the damper is not responding predictably — the force it produces depends on which direction it was moving a moment ago. On the car, that shows up as poor body control and inconsistent feel, particularly over repeated inputs [SEARCH_EVIDENCE].
Cavitation appears as a drop or irregularity in force at high shaft speeds. It indicates the damper is losing damping capacity, often due to low gas pressure or fluid issues. A curve that rises cleanly and then collapses at 0.5 m/s is telling you the damper cannot keep up with the event it is being asked to control [SEARCH_EVIDENCE].
Reading a Dyno Graph for Understeer, Oversteer, and Poor Body Control
Understeer at corner entry often correlates with too much front rebound or too little front compression. The dyno curve shows whether the damper is contributing to the imbalance: if front rebound force is disproportionately high relative to compression, the front is resisting extension and the car will push [SEARCH_EVIDENCE].
Oversteer on exit can be traced to rear rebound that is too stiff or rear compression that is too soft. Comparing front and rear curves side by side reveals the mismatch. A rear damper with significantly more rebound force than the front, at the same velocity, is a common cause of exit oversteer in rear-drive platforms [SEARCH_EVIDENCE].
Poor body control — float, porpoising, a car that never settles — is often a hysteresis or cavitation problem, not a spring rate problem. The dyno is the only way to see it without instrumenting the car. If the curve shows a wide hysteresis loop or a cavitation drop, no spring change will fix it; the damper itself is the issue [SEARCH_EVIDENCE].
When Dyno Testing Beats On-Track Validation — and When It Doesn't
Dyno testing is most valuable when you need to isolate damper behavior from track variables, compare multiple dampers quickly, or verify batch consistency. If you are choosing between three candidate dampers for a production run, the dyno gives you a controlled comparison in an afternoon that would take weeks of track testing to replicate [SEARCH_EVIDENCE].
On-track or on-road validation is irreplaceable for subjective feel, tire interaction, and overall setup. Dyno data cannot predict lap time. It cannot tell you whether the driver will like the car. It measures the damper in isolation, and the car is not an isolated damper [SEARCH_EVIDENCE].
For street-driven cars, the cost and complexity of dyno testing rarely pay off unless the car has a specific handling problem or the buyer is specifying a custom valve stack. A daily driver with a vague complaint about "feeling floaty" is usually better served by inspecting bushings and mounts first — a worn Large suspension bushing — 54584-2D000 or Large suspension bushing — 54584-3S100 can mimic damper failure and costs a fraction of a dyno session [MODEL_ANALYSIS].
Choosing a Dyno Service and What to Demand in the Report
Ask for force-velocity curves at multiple adjustments (if adjustable), hysteresis loops, and a note on test speed and temperature. Without these, the data is not comparable to anything else you have or will receive [SEARCH_EVIDENCE].
Verify the provider's test protocol: shaft speed range, stroke, and whether they test at consistent temperature. Inconsistent protocol makes batch comparisons meaningless. A report that says "tested at 100°C" is useful; a report that says "tested" is not [SEARCH_EVIDENCE].
For importers and wholesalers, request batch testing with statistical summaries — mean and standard deviation for key force points. A batch with a mean that matches the reference and a tight standard deviation is a batch you can sell with confidence. A batch with a wide spread is a warranty claim waiting to happen [MODEL_ANALYSIS].
Common Dyno Testing Mistakes That Distort Results
Testing at inconsistent temperatures or without allowing the damper to warm up changes force readings, especially with hysteresis. A cold damper and a warm damper are different dampers. If the test protocol does not specify warm-up, the numbers are not comparable [SEARCH_EVIDENCE].
Using the wrong stroke or speed range can miss cavitation or fail to capture the low-speed behavior that matters for handling. A test that only sweeps 0.1–0.3 m/s will not show you the high-speed cavitation that causes harshness over sharp bumps [SEARCH_EVIDENCE].
Comparing curves from different test protocols or different dynos without normalization is a common error that leads to wrong damper selection. Two curves that look similar on screen may have been generated at different temperatures, strokes, or speeds. Normalize before you compare [SEARCH_EVIDENCE].
Using Dyno Data for Damper Matching and Batch Consistency
Damper matching requires comparing force-velocity curves to spring rates and corner weights. A damper that is too stiff or too soft in the wrong velocity range will hurt grip and balance, regardless of how good the curve looks in isolation [MODEL_ANALYSIS].
For importers, batch testing with statistical process control (SPC) principles can detect drift before it becomes a warranty problem. If batch 3 shows a 10% shift in low-speed rebound force compared to batch 1, that is a signal to investigate — not necessarily a rejection, but a conversation with the supplier [MODEL_ANALYSIS].
Dyno data can be used to create a damper "fingerprint" for a given part number, which simplifies future purchasing and quality checks. Once you have a reference curve, incoming batches can be compared against it in minutes. This is the same logic that applies to Large suspension bushing — 54584-BU000 and Large suspension bushing — 54584-F9000: a known-good reference makes incoming inspection fast and objective [MODEL_ANALYSIS].
The Limits of Dyno Data: Why Real-World Validation Still Matters
A dyno cannot simulate tire grip, road surface, or driver preference. It only measures the damper in isolation. A damper that produces a beautiful curve on the bench may feel wrong on the road because the tire, the bushing, and the driver are all part of the system [SEARCH_EVIDENCE].
Dyno data is a filter, not a final answer. Use it to narrow options, then validate on the track or road. If the dyno says damper A and damper B are close, the track will tell you which one the driver prefers. If the dyno says damper C is cavitating, you can eliminate it without spending a track day [MODEL_ANALYSIS].
Over-reliance on dyno numbers can lead to a car that looks good on paper but feels wrong to the driver. The dyno is a tool for making decisions, not a substitute for them. Use it to answer the question you actually have — which damper, which setting, which batch — and then confirm the answer in the real world [MODEL_ANALYSIS].
FAQ
Is dyno testing worth it for a street car?
Only if it answers a specific question — a handling problem you cannot diagnose otherwise, or a custom valve stack you are specifying. For a vague "floaty" complaint, inspect bushings and mounts first; a worn Large suspension bushing — 54584-2D000 or Large suspension bushing — 54584-3S100 can mimic damper failure at a fraction of the cost [MODEL_ANALYSIS].
Can a dyno tell me which damper will be faster on track?
No. It measures the damper in isolation. It cannot predict lap time or driver preference. Use it to eliminate bad options, then validate on track [SEARCH_EVIDENCE].
What should I ask for in a dyno report?
Force-velocity curves at multiple adjustments, hysteresis loops, and the test speed and temperature. Without those, the data is not comparable to anything else you have [SEARCH_EVIDENCE].
How do I use dyno data to check batch consistency?
Request mean and standard deviation for key force points. A batch that matches the reference mean with a tight spread is sellable; a wide spread is a warranty risk. A 10% shift in low-speed rebound versus batch 1 is a signal to investigate, not necessarily reject [MODEL_ANALYSIS].