Hydraulic Damper Testing: How to Read a Force-Velocity Curve and Decide Keep, Replace, or Spec
A hydraulic damper cannot be judged by how the car feels or by a bounce test. It must be measured across a velocity range, and the resulting force-velocity (F-V) curve is the only reliable basis for deciding whether it is serviceable, matched to the application, or failing.
That is the whole discipline in one sentence. Everything below is how to execute it.
Why the Bounce Test Cannot Tell You If a Damper Is Serviceable
Push down on a vehicle corner and watch it rebound. You are exciting the suspension at roughly 1–2 Hz and very low shaft velocity — a fraction of the velocity range a damper sees in real road events, where shaft speeds routinely reach 0.5 m/s or more.
A damper can pass a bounce test with flying colors and still be significantly out of specification at the mid and high shaft velocities that govern body control and wheel control.
The bounce test has limited value: it can reveal gross failures. A completely blown damper with no gas charge will often show excessive bouncing. A seized shaft will resist movement entirely. But it cannot quantify force output, hysteresis, or velocity-dependent behavior. It gives you a binary feel impression, not data.
The only reliable basis for a serviceability decision is a measured F-V curve across a defined velocity range. That curve is what a damper dyno produces, and it is the artifact you should be making decisions from. Bounce tests, road feel, and visual inspection are supplementary.
What a Damper Dyno Actually Measures: Force, Velocity, and the F-V Curve
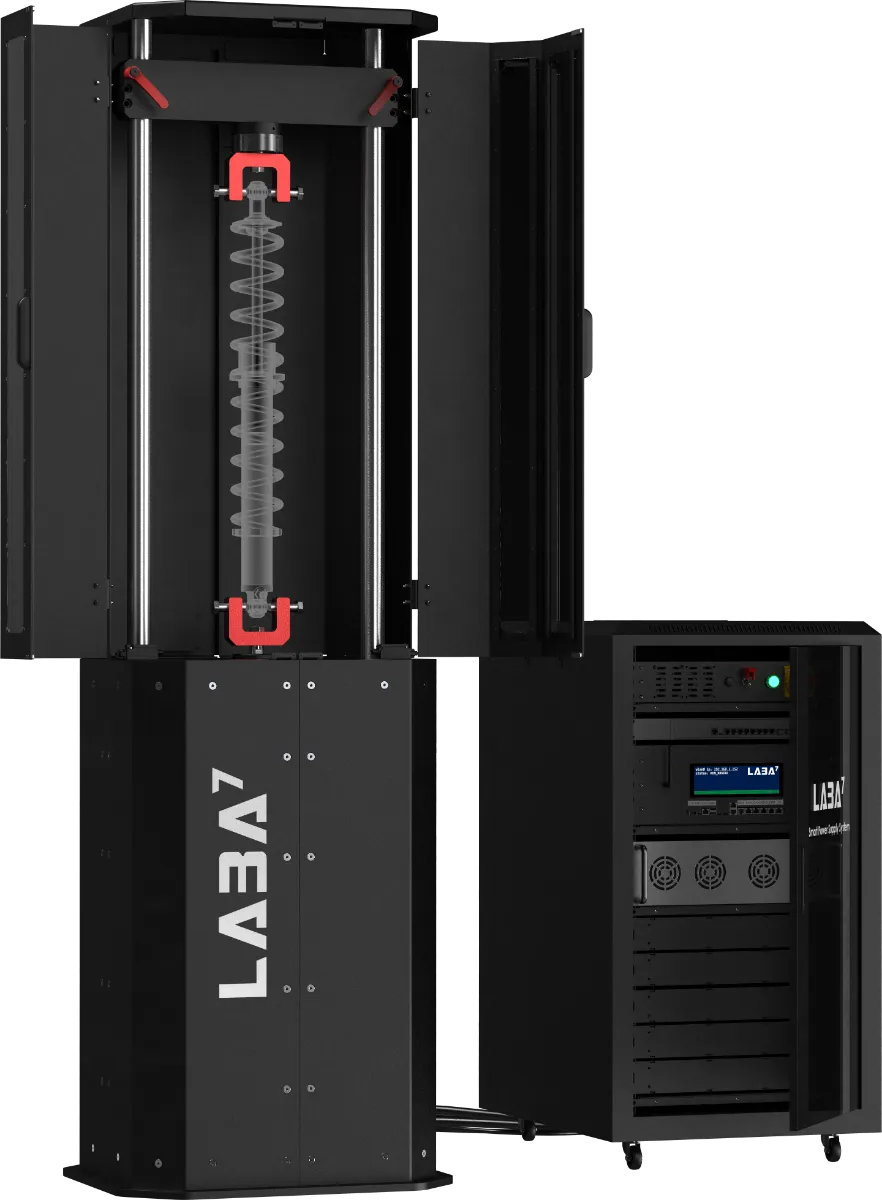
A damper dyno drives the shaft through a controlled displacement or velocity profile and measures the resulting force, producing an F-V curve. That curve is the damper's signature. It shows compression and rebound force at each velocity point, and the shape reveals valving behavior that no single force number can capture.
Damper force is velocity-dependent by design. A damper that produces correct force at 0.1 m/s can be wrong at 0.5 m/s, and the curve is what exposes that. Measure one velocity and you are looking at one point on a complex map. The curve must be read as a set of decision points — low-speed bleed, mid-speed knee, high-speed blow-off — not as a single pass/fail value.
Reading the F-V curve is the core skill in hydraulic damper testing. It tells you whether the damper is functioning as designed, whether it has degraded internally, and whether it matches a target specification for a given application.
Step-by-Step Damper Dyno Test Procedure: Stroke, Velocity Range, and Temperature Control
Running a valid damper dyno test requires controlled parameters. The procedure below is the baseline for decision-grade data.
Mounting and Alignment
The damper must be fixtured on-axis with the dyno actuator. Off-axis or compliant mounting introduces side loads and corrupts force readings. Use rigid fixtures that hold the damper body and shaft in precise alignment. Any compliance in the mounting will absorb force and add phase lag, making the damper look weaker or slower than it is.
Stroke Selection
The test stroke must be representative of the damper's working range and must not exceed the damper's travel limits. Short strokes can mask behavior that appears at longer travel — such as cavitation or topping-out. For most automotive dampers, a stroke of 50–100 mm covers the relevant range, but always verify against the damper's specified travel.
Velocity Range
Test across the range the damper sees in service. This typically means from low-speed (around 0.05–0.1 m/s) through mid-speed to high-speed (often up to 0.5–1.0 m/s or beyond, depending on application). The velocity range must be wide enough to capture the knee and blow-off behavior that defines the damper's character.
Temperature Control
Damper force changes with temperature. As the damper cycles, fluid temperature rises and force output typically falls. The test must be run at a controlled and recorded temperature. Cycle the damper to stabilize before data is captured — typically 5–10 warm-up cycles. Record the stabilized temperature alongside the data.
Data Capture
Record force and velocity continuously through the stroke. Repeat runs to confirm repeatability before interpreting the curve. A single run is not enough; you need to see that the curve is stable across multiple cycles.
Comparing Test Methods: Full-Range Stroke, Sine Sweep, and Single-Speed
Different decisions require different test methods. Choosing the wrong method wastes time or produces incomplete data.
Full-range stroke testing captures the damper's behavior across its full travel. It is suited to detecting travel-dependent issues such as cavitation, topping-out, and bottoming behavior. If you need to know how the damper behaves at the extremes of its travel, this is the method.
Sine sweep testing drives the damper through a continuous range of frequencies and velocities, producing a dense F-V curve. This is well suited to valving characterization and comparison against a target curve. It gives you the most complete picture of the damper's velocity-dependent behavior.
Single-speed testing measures force at one or a few discrete velocities. It is fast and useful for incoming inspection or pass/fail screening, but it cannot reveal curve shape or mid-speed behavior. A single-speed check can screen for gross failure, but a keep/replace or supplier decision requires a curve across the relevant velocity range.
The method must match the decision. For a quick incoming inspection, single-speed may suffice. For valving development or a serviceability decision, you need a full curve.
Reading the F-V Curve: What the Shape Tells You About Handling and Serviceability
The F-V curve is a decision tool. Each region of the curve corresponds to a specific vehicle behavior.
- Low-speed region (roughly 0.05–0.2 m/s): governs body roll, pitch, and steering feel. A curve that is too low here produces float and excessive body motion. Too high produces harshness and poor compliance.
- Mid-speed region (roughly 0.2–0.5 m/s): governs transient response and wheel control over typical road inputs. This is where mismatched or worn dampers most often show up as vague handling.
- High-speed region (above roughly 0.5 m/s): governs impact absorption and wheel control over sharp bumps. A curve that is too high here causes harshness and loss of grip. Too low causes bottoming and poor impact control.
- Curve asymmetry: compression and rebound are tuned separately. A curve that is correct in rebound but weak in compression (or vice versa) points to a specific valving or wear issue, not a general failure.
Deviation from a known-good or target curve is the serviceability signal — not the presence of any single force value. You need a reference curve for the same part number and application to make a valid comparison.
Common Pitfalls in Hydraulic Damper Testing — and How to Avoid Them
Invalid test data leads to wrong decisions. These are the failure modes that corrupt damper dyno results.
- Temperature drift: damper force falls as temperature rises during a run. Without stabilization and temperature recording, the curve reflects test duration, not the damper. Always warm up the damper and record temperature.
- Mounting compliance: soft or misaligned fixtures absorb force and add phase lag, making the damper look weaker or slower than it is. Rigid, on-axis fixturing is required.
- Calibration errors: load cell and displacement calibration drift directly scale the curve. Calibration must be verified before a decision-grade test. A 5% calibration error is a 5% error in every force reading.
- Insufficient settling cycles: skipping the warm-up cycles means the first recorded run is not representative. Discard warm-up runs and record only stabilized data.
- Ignoring hysteresis and gas force: the curve has a compression/rebound loop. Reading only one direction or ignoring gas force can mislead the serviceability judgment. The full loop tells the story.
From Symptoms to Data: Confirming or Contradicting a Failing Damper
Real-world symptoms — leaks, noise, poor handling, uneven tire wear — can point to a damper, but they can also come from springs, bushings, or tires. The F-V curve isolates the damper contribution.
Visible fluid leakage is a definitive failure indicator, but a damper can lose gas charge or develop internal valving wear without external leakage. The curve is what confirms internal degradation.
Road-feel symptoms such as float, excessive roll, or poor impact control can come from multiple sources. A damper that passes a bounce test but shows a collapsed or shifted F-V curve is a confirmed internal failure that the bounce test could not detect.
Conversely, a damper with a normal F-V curve but poor road feel points the diagnosis away from the damper — saving an unnecessary replacement.
Test data should be compared against a target or known-good curve for the same part number and application, not against a generic specification. This is where having a reference curve from the manufacturer or a known-good unit is essential.
Making the Keep/Replace/Spec Decision: A Practical Checklist for Buyers and Technicians
Use this checklist to convert test data into a decision.
- Keep: the F-V curve matches the target or known-good curve within an acceptable tolerance across the relevant velocity range, with no collapse, shift, or abnormal hysteresis.
- Replace: the curve shows a collapsed low-speed region, a shifted knee, excessive asymmetry, or a high-speed region that no longer controls impact — regardless of bounce-test feel.
- Spec: when specifying a replacement or evaluating a supplier, require a velocity-dependent F-V curve for the part number and application, not a single force number or a feel description.
- Supplier evaluation: ask for the test method, velocity range, temperature, and calibration status behind any curve you are given. A curve without those parameters is not decision-grade.
- Documentation: record the test parameters and the curve together, so the decision can be reviewed and compared against future tests.
For buyers and importers evaluating suspension components, this data-driven approach is the only way to verify supplier QC claims. Visual inspection and bounce tests are not enough. If you are sourcing automotive suspension components, require F-V curves as part of your quality documentation. Our quality control processes are built around measurable performance, not subjective checks. To learn more about our approach, visit about our company or see our manufacturing facility.
FAQ
Can I use a bounce test to decide if my dampers need replacement?
No. The bounce test only reveals gross failures. A damper can pass a bounce test and still be significantly out of specification at mid and high shaft velocities. You need a force-velocity curve to make a valid decision.
What velocity range should I test a damper at?
Test from low-speed (around 0.05–0.1 m/s) through mid-speed to high-speed (often up to 0.5–1.0 m/s or beyond, depending on application). The range must cover the velocities the damper sees in service.
How do I know if a damper dyno test is valid?
A valid test has controlled temperature, rigid on-axis mounting, verified calibration, and repeatable results across multiple runs. If any of these are missing, the data is not decision-grade.
What does a collapsed low-speed region on the F-V curve mean?
It means the damper is not producing enough force at low shaft velocities, which will cause float, excessive body roll, and poor steering feel. This is a common sign of internal wear or gas loss.
Can a damper fail internally without leaking?
Yes. Gas charge loss and valving wear can occur without external leakage. The F-V curve is the only way to confirm internal degradation.