Damper Force-Velocity Testing: How to Read Dyno Graphs and Make Better Suspension Decisions
Force-velocity data is the most objective way to compare dampers—provided you know the test conditions behind the graph. Subjective feel is contaminated by tires, spring rates, bushings, and driver preference. A dyno curve isolates the damper as a variable. That isolation is the only reason the data matters.
When a buyer or mechanic evaluates a damper by feel alone, they are evaluating the entire suspension system. A harsh ride might come from stiff springs, worn bushings, or high tire pressures. A floaty feel might come from insufficient low-speed damping or excessive gas pressure. Force-velocity data removes those confounds by measuring only what the damper contributes.
A curve generated at 20°C with a 2-inch stroke at velocities from 0.5 to 10 in/s tells you something specific. The same damper tested at 60°C with a different stroke tells you something different. Without that context, a force-velocity graph is just a shape.
For buyers comparing aftermarket dampers or wholesale importers evaluating supplier claims, force-velocity data is the most objective comparison tool available—but only when test conditions are documented. Ask for the test protocol before you ask for the graph.
How to Read a Force-Velocity Graph: Axes, Compression, and Rebound
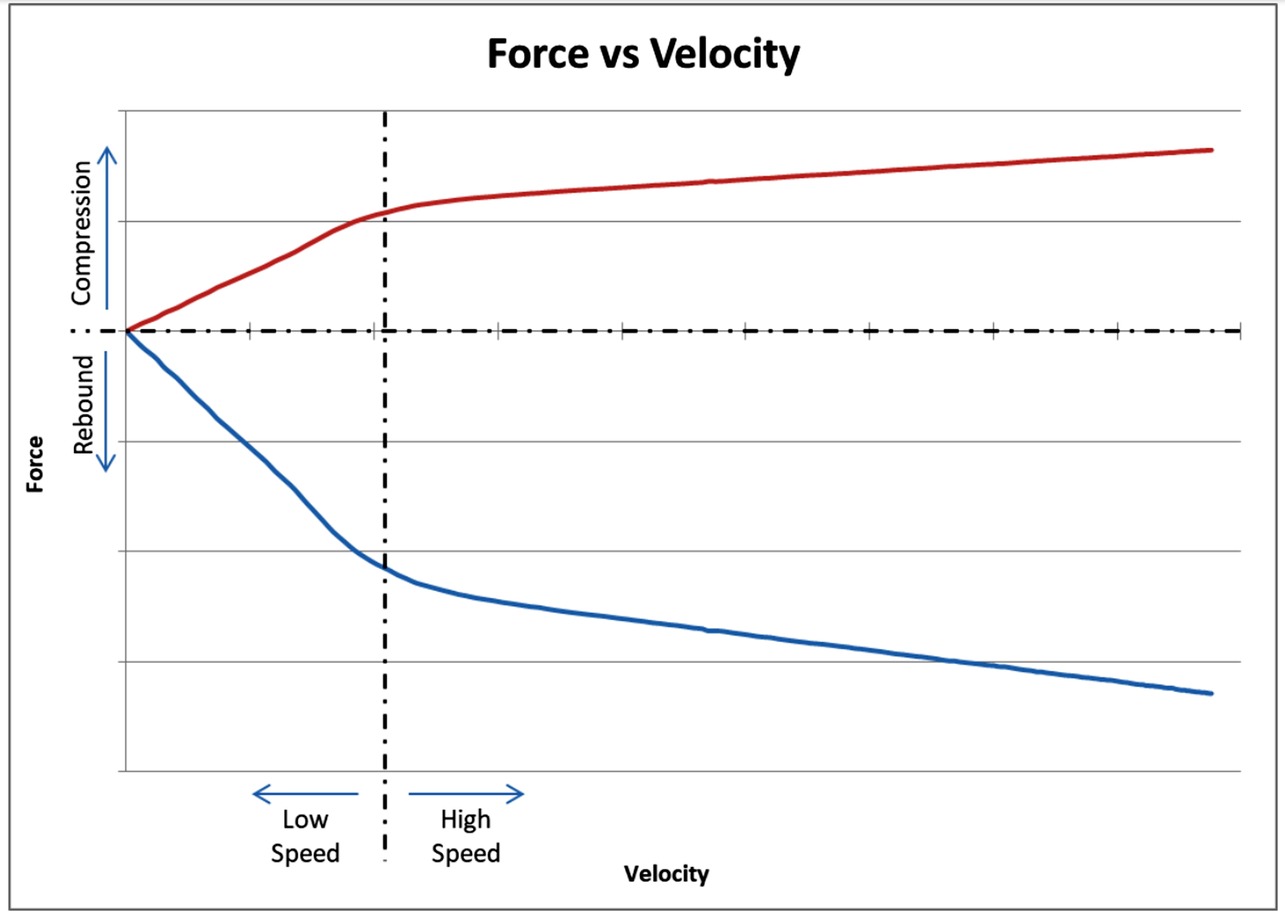
The X-axis is shaft velocity (typically in in/s or mm/s); the Y-axis is force (typically in lbf or N). Do not assume a default sign convention. Some dyno software plots compression as positive force and rebound as negative; others do the opposite. Roehrig and Öhlins systems, for example, have historically used different conventions depending on software version and configuration. Before interpreting any curve, confirm with the test operator or supplier which direction the dyno defines as positive.
Compression curves show force generated as the damper compresses; rebound curves show force as it extends. The two are plotted separately or as a loop. On most dyno software, you will see two distinct traces: one for the compression stroke and one for the rebound stroke. Where they diverge tells you how the damper is valved.
A steeper curve at low velocity indicates high low-speed damping (often controlled by bleed or preload); a flatter curve at high velocity indicates blow-off or shim-controlled high-speed behavior. The transition point—where the curve bends from steep to flat—is the knee. The shape and location of that knee define the damper's character more than any single force number.
When you first look at a force-velocity graph, identify three things: the velocity range shown, the force scale, and which trace is compression versus rebound. Without those three anchors, you cannot compare one graph to another. Most dyno software labels the axes, but not all label which trace is which. Confirm with the test operator or the supplier.
Low-Speed vs High-Speed Damping: What the Curve Shape Means on the Road
Low-speed damping (typically 0–2 in/s) controls body roll, pitch, and driver inputs—it dominates in cornering, braking, and steering transitions. High-speed damping (typically above 3–5 in/s) controls impact absorption over sharp bumps and curb strikes—it determines ride harshness and tire contact over rough surfaces.
The transition between low-speed and high-speed regions (the knee of the curve) is where most tuning decisions live. A sharp knee feels more aggressive because the damper transitions abruptly from high force to low force as velocity increases. A rounded knee feels more compliant because the transition is gradual.
For a daily-driven vehicle, a digressive curve—high low-speed force, reduced high-speed force—often provides the best compromise: body control in corners without harshness over broken pavement. For a track-focused car, a more linear curve may be preferred because it provides more consistent force across the velocity range, which helps the driver predict grip.
When comparing dampers, overlay their curves at the same velocity points. A damper with higher low-speed force will feel more controlled in transitions but may ride stiffer. A damper with lower high-speed force will absorb bumps better but may feel less planted at speed. Neither is universally better—it depends on the application.
Hysteresis and Friction: What They Reveal About Damper Quality and Consistency
Hysteresis is the difference in force between the compression and rebound strokes at the same velocity—a wide loop indicates internal friction, gas pressure imbalance, or seal drag. High hysteresis means the damper is not returning energy consistently, which can cause unpredictable grip over repeated bumps.
Friction is measured as the force required to move the shaft with no valving input (often tested at very low speed); excessive friction masks low-speed damping and reduces driver feedback. If a damper has high friction, the low-speed portion of the curve will show elevated force even at near-zero velocity, which can make the damper feel artificially stiff at low speeds.
A healthy damper shows a narrow hysteresis loop and low friction. A damper with a wide loop or high friction may still produce acceptable peak force numbers, but it will not perform consistently. When evaluating a damper for purchase or revalving, hysteresis and friction are often more revealing than peak force.
Decision rule: There is no universal pass/fail number, but for typical automotive dampers, a hysteresis band exceeding roughly 10–15% of peak force at a given velocity is a red flag. If you are comparing two dampers of the same type, the one with the narrower loop at matched velocities is the better-built unit. Ask the supplier for hysteresis data at 0.5 in/s and 2 in/s—if they cannot provide it, treat the damper as unverified.
To measure hysteresis, run the damper through a full compression and rebound cycle at a constant velocity and record the force in both directions. The difference between the two traces at the same velocity is the hysteresis. Repeat at several velocities to see how it changes with speed.
Temperature Effects: Why Consistent Test Temperature Matters More Than You Think
Damper oil viscosity drops as temperature rises, which reduces force at all velocities—a damper tested cold will show higher forces than the same damper tested hot. A single dyno pull can raise damper temperature significantly, so the first cycle often looks different from the fifth; consistent test temperature is required for valid comparisons.
Some dynos offer temperature compensation or require a warm-up protocol; without it, comparing a cold damper to a warm one is meaningless. Industry common practice is to warm the damper with 20–30 cycles at moderate speed until the force traces stabilize, then begin data collection. If the force drops between the first and fifth cycle, the damper is still warming up.
Decision rule: Never compare two graphs unless both were collected at the same stabilized temperature. If a supplier cannot state the test temperature, the data is not comparable. Ask for the warm-up protocol and the stabilized temperature before you look at the curve.
Temperature also affects gas pressure. As the damper heats up, gas pressure increases, which can change the force curve. This is another reason why consistent test temperature matters: it controls both oil viscosity and gas pressure, two variables that directly affect force-velocity results.
Step-by-Step Damper Dyno Test Procedure: Equipment, Setup, and Calibration
Equipment: a servo-hydraulic or crank-driven damper dyno with load cell and displacement sensor; verify load cell calibration with known weights before testing. A load cell that is out of calibration will produce force numbers that are consistently wrong, which makes comparisons invalid.
Setup: mount the damper in the dyno with the correct stroke and velocity profile; ensure the shaft is aligned to avoid side loading, which adds friction and skews results. Side loading is a common error: if the damper is not aligned with the dyno's motion axis, the shaft will bind, and the force curve will show elevated friction and hysteresis.
Procedure: warm the damper to a stable temperature (e.g., 20–30 cycles at moderate speed), then run a sweep of velocities (e.g., 0.5, 1, 2, 5, 10 in/s) in both compression and rebound, recording force and displacement. Data acquisition: sample at a high enough rate to capture the full loop (typically 100–1000 Hz), and average multiple cycles to reduce noise.
After collecting data, check for consistency: run the same velocity point at the beginning and end of the test. If the force has changed significantly, the damper temperature or gas pressure has shifted, and the data may not be valid. Repeat the test if necessary.
Comparing Dampers Objectively: Data Pitfalls and Cross-Dyno Reality
Never compare peak force numbers alone; compare the full curve shape at matched velocities and temperatures. Different dynos use different velocity profiles (sine vs ramp), stroke lengths, and gas pressure settings—these change the curve, so cross-dyno comparisons require knowing the test protocol.
Common data acquisition pitfalls: aliasing from low sample rates, load cell drift, and averaging that hides cycle-to-cycle variation. If the sample rate is too low, the dyno will miss the peak force, and the curve will look smoother than it actually is. If the load cell drifts during the test, the force numbers will be offset.
Supplier checklist—copy this into your next email:
- Velocity range and specific velocity points tested (e.g., 0.5, 1, 2, 5, 10 in/s)
- Test temperature and warm-up protocol (cycles, speed, stabilization criteria)
- Stroke length and velocity profile (sine vs ramp)
- Gas pressure setting during test
- Single pull or average of multiple cycles (and how many)
- Sample rate (Hz)
- Load cell calibration date and method
- Hysteresis data at 0.5 in/s and 2 in/s
A supplier who cannot provide that information is either not testing properly or not sharing the full picture. Either way, the data is less useful for comparison.
When comparing dampers from different manufacturers, look for the same velocity points. If one graph shows 0.5, 1, 2, 5, 10 in/s and another shows 1, 3, 6, 12 in/s, you cannot directly compare them without interpolating. Ask for data at matched velocities.
What Dyno Data Can't Tell You: The Case for Track and Road Validation
Dyno testing isolates the damper but cannot simulate vehicle dynamics: spring rates, tire compliance, suspension geometry, and driver inputs all interact with damper behavior. A damper that looks ideal on the dyno may feel wrong on the car due to mismatched spring rates or bushing compliance.
Use dyno data to narrow choices and predict trends, then validate on track or road with controlled back-to-back testing. If you are choosing between two dampers, use the dyno data to identify which one has the curve shape you want, then test both on the vehicle to confirm.
On-vehicle validation is also where you catch installation issues: a damper that performs well on the dyno may underperform on the car if it is mounted at an angle that causes binding, or if the spring rate is outside the damper's intended range. Dyno data gives you a starting point; the vehicle gives you the final answer.
For buyers, this means that force-velocity data is a screening tool, not a final decision tool. Use it to eliminate dampers that clearly do not match your needs, then rely on vehicle testing to make the final choice.
Frequently Asked Questions
What is the difference between force-velocity and velocity-force graphs?
They are the same data plotted with axes swapped. Force-velocity is more common in damper testing because it shows force as a function of velocity, which is how the damper behaves on the vehicle.
How do I know if a damper is blown?
A blown damper typically shows very low force across all velocities, often with a flat curve. It may also show excessive hysteresis or inconsistent runs. If the force is significantly lower than a known-good damper of the same model, it is likely blown.
Can I compare dyno data from different dynos?
Only if you know the test protocol: velocity profile, stroke, temperature, and gas pressure. Without that, cross-dyno comparisons are unreliable. Ask for the protocol before comparing.
How do I compare hysteresis between two dampers?
Run both at the same velocity and temperature, then compare the width of the loop at matched points. The narrower loop is the better-built unit. If you cannot get matched-velocity hysteresis data from a supplier, treat the comparison as inconclusive.
What should I ask a supplier before buying?
Use the supplier checklist above: velocity range, temperature, stroke, gas pressure, single pull vs. average, sample rate, and hysteresis data. If they cannot answer, the data is not decision-grade.
---
Related